Cluster Analysis OS: Part 2 (Illustrate Solution)
Start: 1.
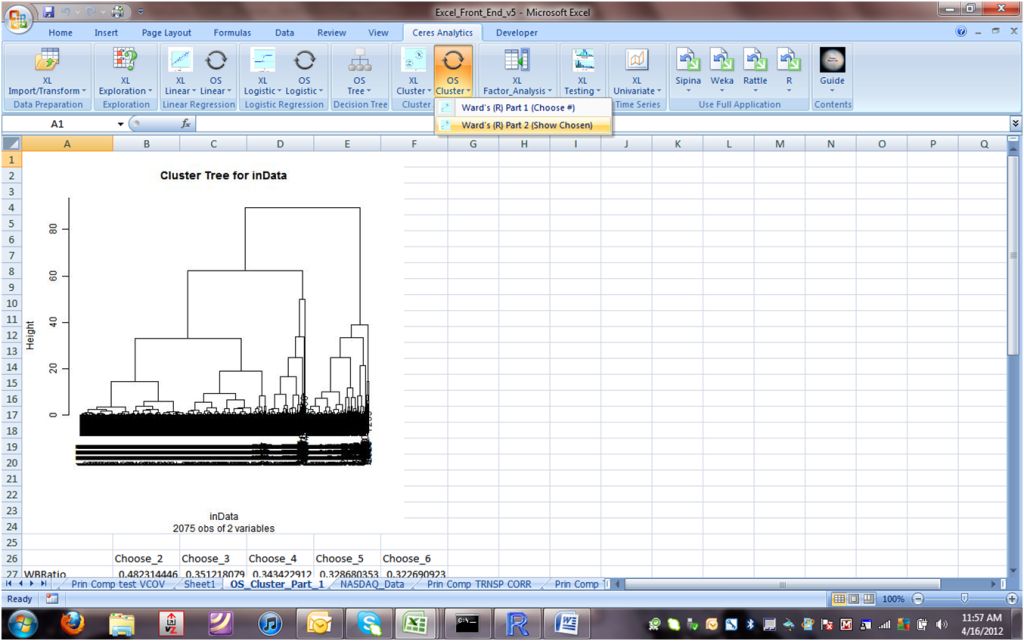
In the "Cluster Analysis" group, "OS Cluster" tab, choose "Ward's (R) Part 2 (Show Chosen)" from the menu.
2.
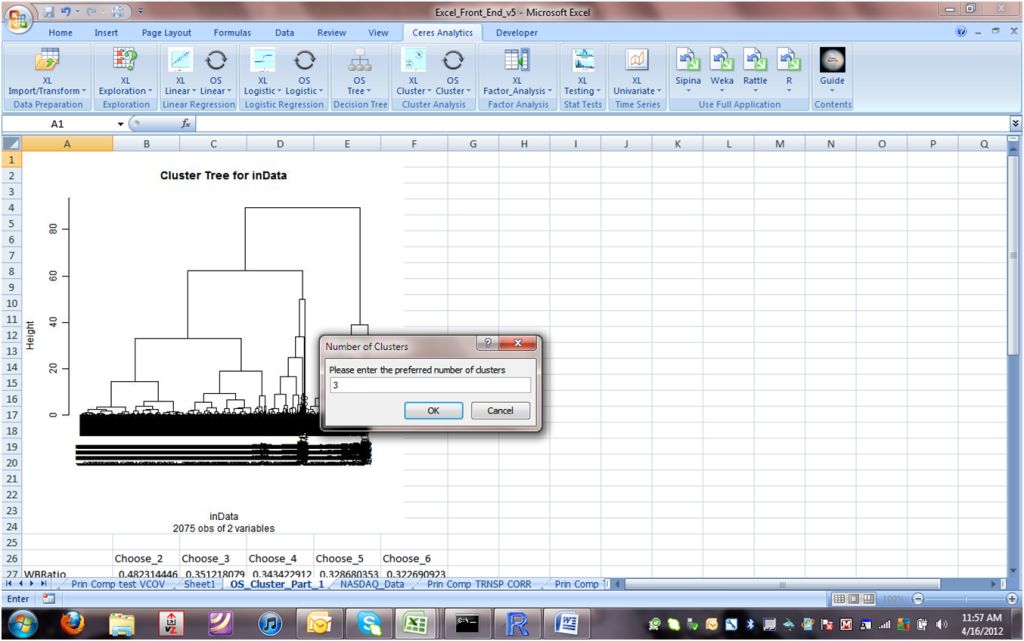
You'll be asked for the preferred number of clusters:
3.
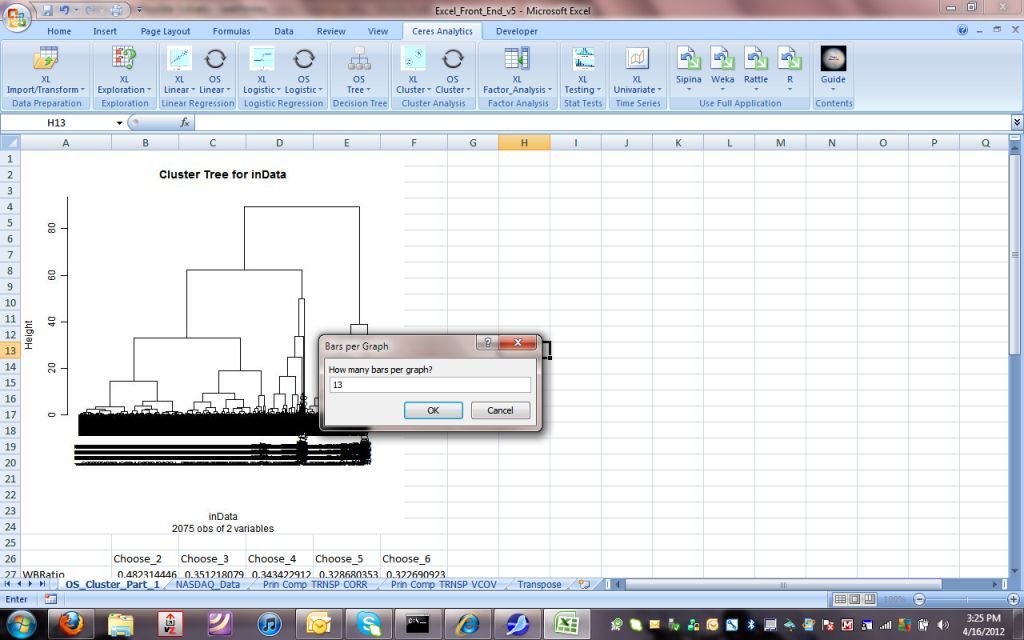
To prepare for possible export to PowerPoint, you can choose the height of the graphic plots:

4.
For the profile histograms, you can choose how fine (or chunky) you'd like the display.
Here, we'll choose a number in the middle, spreading the observations in each histogram among 13 bars:
5.
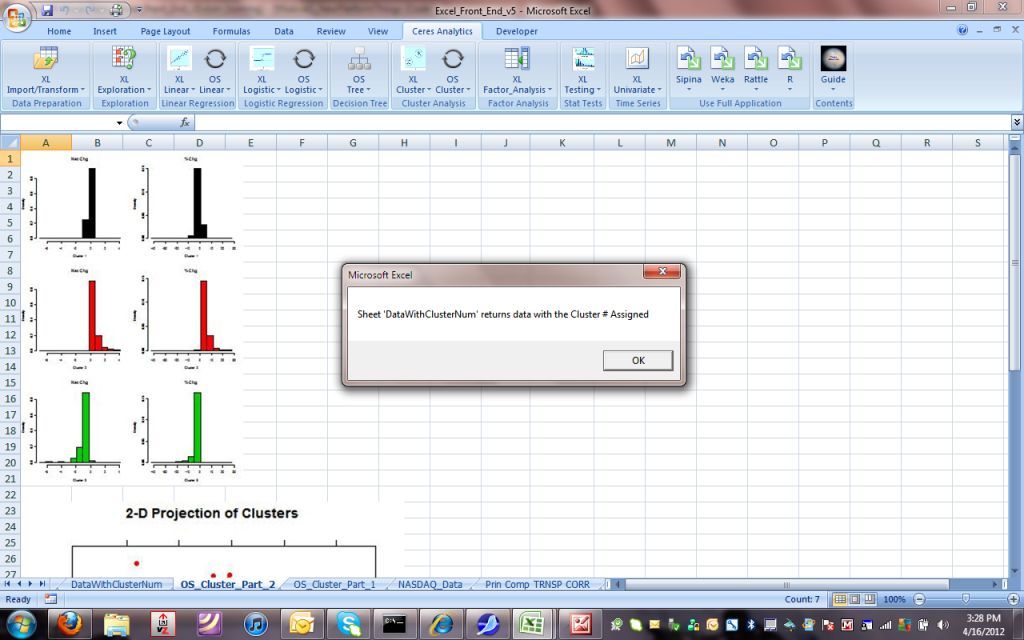
The first of two charts shows the profile histograms.
In this example, for simplicity, we worked with only two measures:
- $ absolute price change
- % proportionate price change
| Cluster# |
$ Absolute Change Skewed... |
% Proportionate Change
Skewed... |
| 1 |
Low |
High |
| 2 |
High |
High |
| 3 |
Low |
Low |
Also, after the charts are pulled into Excel, you'll be told where the data with the cluster indicator are saved.
Note: again, for larger-scale applications, where the data are unsuitable for Excel, we point the platform to the relevant data source
and report accordingly.
6.
The cohesion and dispersion of the clusters is illustrated in two-dimensional space through R's Multi-Dimensional Scaling algorithm:
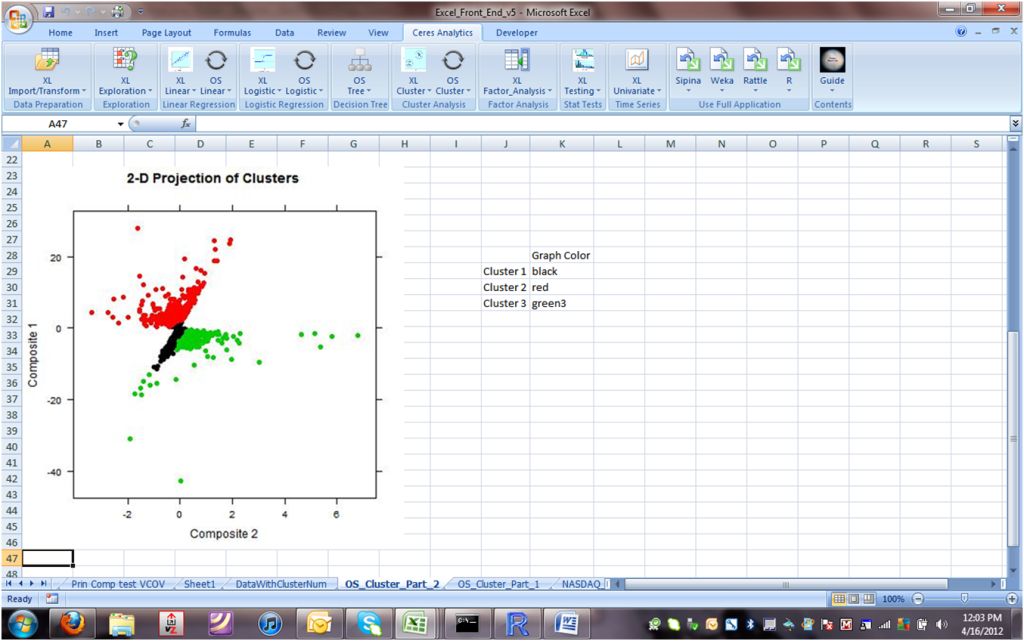
Conclusion
We can see that the smallest cluster, #1, is quite compact. A number of outliers distort clusters 2 and 3:
these must be the few observations that were grouped into the tiny clusters when we looked at solutions from 4 to 6 clusters.
Of course, given that we used only two variables for clustering, the concept of a two-dimensional illustration is not as impressive as it would be if we'd clustered with more variables.
Nonetheless, Cluster 1 merits investigation. The implication is that Cluster 1 contains lower-priced stocks, where a penny change represents a large percentage. Perhaps Cluster 1 contains lower-priced stocks, of which the price is so low that any change in $ price is necessarily a large percent.
Re-running the cluster analysis with more variables will, of course, give a different solution.
Logically speaking, this cluster analysis tells us about stock price volatility in both absolute and relative senses.