|
|
|
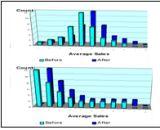
1. Comparison Tests
|
What
|
Test whether two
groups are the same, or whether one group is the same in two
different time periods. |
|
When
|
When there is a reason to
expect a difference, such as:
- implementation of a policy or program (one group before a
marketing campaign vs. after)
- an experiment (two groups at the same time: one received a
drug and the other didn't)
|
Where/Who
|
- If "When" is before vs.
after, then "Who" would be the affected group (the same
subjects at both times)
- If "When" relates to an experiment, then "Who" would be
two different groups (different subjects at the same time)
|
Why
|
To learn whether an action
(business policy, administration of drug, marketing
campaign) makes a difference
|
How
|
- The kind of test depends on
the underlying distribution of the trait being
measured. Different tests have different definitions
of the "center of the distribution". Some tests do not
require a center.
- Many health or social phenomia are normally distributed
(the familiar bell curve which is symmetric about its
center).
- Many business phenomena are skewed to one end (i.e.,
retail transactions: there are often more at the low end
than the high).
- In this seminar, we review how to choose the tests, and
then we conduct the tests. |
|
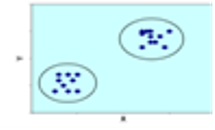
2.
Cluster Analysis
|
What
|
Find groups that contain
subjects (customers, students, research participants,
products) that are as similar to other subjects in the group
as possible, while the groups are as different from each
other as possible
|
 |
When
|
You want to learn what key
groups constitute the whole. You have a few (or
several) traits that are strategically important to
grouping.
|
Where/Who
|
Customers, research
participants, products, etc.
|
Why
|
- Knowledge of key
groups--and their sizes--can help a business to tailor
strategy to its market. By using cluster analysis to
segment the market, we're assured that the market segments
will be defined in groups that are as unique as possible in
terms of the traits used to define them.
- Profiles of the clusters are telling. Often segments
are named based on the relative value of the traits (e.g., "
'Thrifty frequent buyers' are the source of 30% of our
business despite their small transactions, simply because
they shop 2-3 times a week.")
|
How
|
Ceres' research and
experience has led to a method with consistently superior
results. That method is programmed in the Ceres
platforms and covered in this seminar. Graphic
profiling tools are also implemented.
|
|
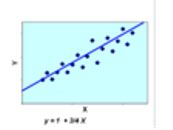
3.
Linear Regression Analysis
|
What
|
Predict the level of a
continuous measure from other measures, including
continuous, qualitative, and yes/no characteristics
|
|
When
|
You want to forecast
something or understand the relative impacts its drivers
(magnitude, certainty)
|
Where/Who
|
- Aggregates (e.g., total
sales) or individuals (amounts of customer purchases)
- Time Series (quarterly home values, student GPA's, GDP),
Cross-sections (processing time for different manufacturing
pieces), or Pooled Corss-section and Time Series (panel data
for a group of people observed every year)
|
Why
|
- Forecasting business
measures (unit sales, revenues, number of customers) can
lead to reliable planning for both supply and financial
purposes
- Understanding the relative impacts of a measure's drivers
enables "what if" scenario analysis. Hypothetical
values for the drivers can translate into expected forecasts
for unforeseen circumstances (e.g., a substantial drop in
GDP for a sales forecast driven by GDP)
|
How
|
- In the case of only one
predictor, linear regression places the line closest to the
data (in light of a few mathematical considerations)
- The line has a formula that is a lot like the old "y=mx+b"
of middle-school algebra. In that formula, "m"
represents "rise over run". In business, it could
instead represent something like sales per dollar spent on
advertising.
- In linear regression, unit steps in the predictors (X's)
beget unit steps in what you're predicting (Y, also called
the "dependent variable")
- Multiple regression works the same way, except that the
"line" becomes abstract in numerous dimensions
|
t
|
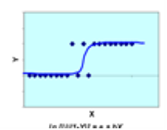
4. Logistic Regression
Analysis
|
What
|
Predict a yes/no answer from
other measures, including continuous, qualitative, and
yes/no characteristics
|
|
When
|
You want to predict a yes/no
outcome or understand what drives it (magnitude, certainty)
|
Where/Who
|
- Many yes/no outcomes merit
prediction: customers' decisions whether to buy a
product; members' decisions whether to increase or decrease
subscribed services; whether a patient lives or dies
|
Why
|
- Understanding the key
drivers of a yes/no outcome enables targeting of actions
that evoke a yes/no response |
How
|
- In the case of only one
predictor, logistic regression places the "S-curve" closest
to the data (in light of a few mathematical considerations)
- The S-curve's formula is a lot like linear regression's
"y=mx + b" But instead of "unit steps in Y", you're
predicting "proprtionate steps in the odds of Y". (Y=1
is usually yes; Y=0 is usually no).
|
|
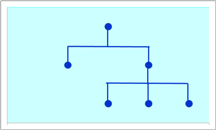
5.
Decision Tree (CHAID)
|
What
|
CHAID (Chi-Square Automated
Interaction Detector) identifies segments (of customers,
patients, accounts) based on key interactions of predictive
variables
|
|
When
|
- Predictors are expected to
compound one another and/or to be mutually exclusive.
- One measure can be selected as the basis on which to
derive splits (i.e., as the "dependent variable", just like
"Y" in regression)
|
Where/Who
|
- CHAID is used in
identifying key interactions that explain yes/no questions
- A similar technique, C&RT (Classification and
Regression Trees) can answer questions posed by both yes/no
and continuous data variables (e.g., for the latter, "What
combinations of customer characteristics segment the level
at which they spend?")
|
Why
|
- A decision tree gives a
"50,000 foot view" of the terrain that comprises the
question a business is examining
- When a question begins with "What combinations of...", the
answer often begins with a decision tree, and may end with
the decision tree, as well.
|
How
|
- Automated search techniques
find the breakpoints in predictors, and select the
predictors, which correspond most strongly to the divisions
of the dependent variable
|
|
6. Factor Analysis
(Principal Components)
|
What
|
Factor Analysis is a data
reduction technique. It reduces a large number of
variables to a few key, underlying composites
|
|
When
|
- The objective is to
represent key concepts in a few lean, efficient predictors
- The objective is to determine how many truly independent
concepts are embodied in a big "mish-mash" of data |
Where/Who
|
Factor Analysis is well-known
for its use in stock market analysis, where multitudes of
financial accounting measures are collected into risk
factors like "the Growth Factor", "the Volatility Factor",
etc. (cf. MSCI Barra, http://www.msci.com/products/indices/strategy/risk_premia/factor/)
|
Why
|
- Comparisons based on a
composite are easier to interpret than numerous comparisons
- In regression analysis, if your data matrix has more
columns than rows, then you can't extract maximum value from
it unless you compact many of its columns.
|
How
|
- Principal Components shares
the mathematics of physics' quantum mechanics:
- eigenvectors report the
amount of information captured by the first--and each
subsequent--composite variable
- eigenvalues designate the weights applied to source
variables to generate the composites
|
|
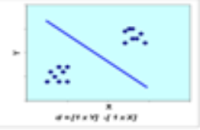
7.
Linear Discriminant Analysis
|
What
|
Linear Discriminant Analysis
articulates "bright lines" that distinguish groups of
individuals (customers, patients, accounts, etc.)
|
|
When
|
It's crucial to understand
the relative importance of predictors that separate numerous
groups from another (logistic regression can have multiple
outcomes, as well, but LDA is more straightforward)
|
Where/Who
|
Market segments (customers,
patients, accounts) that have contrasting profiles on key
measures.
|
Why
|
- Understanding the relative
importance of distinguishing factors enables a business to
improve service to important segments
- When the measure that distinguish segments can be
influenced by management, then a business has an opportunity
to improve its business by helping customers migrate "across
the line" from a bad to a good segment
|
How
|
Like Principal Companents,
LDA is also rooted in eigenvalues. But its objective
is different. Whereas PC reduces the number of columns (variables) of
a data matrix, LDA articulates the separation of data rows through a function
that classifies them.
|
|
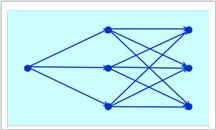
8. Neural Network
backward propagation as an introduction to machine
learning
|
What
|
- An early technique of
artificial intelligence
- Neural networks focus on pattern recognition
- Neural nets preceded most current analytic methods of
machine learning
- Many statistical methods
have machine-learning counterparts, also referred to as
"kernel methods".
- By gaining familiarity with neural nets, an analyst can
quickly gain the background to branch out into kernel
methods
|
|
When
|
- Only the resulting
prediction is required; the relative importance of the
predictors can remain unknown within a "black box"
- Historical patterns are non-linear and virtually
intractable
|
Where/Who
|
Same as Linear Regression
Analysis
|
Why
|
- When direct association
between the dependent variables and the predictors cannot be
observed, or complex interactions are suspected, a neural
net can find a way to associate the outcome with the inputs
- Often, a neural network model can serve as a "test" to
determine whether reliable predictions can be obtained when
regression has failed, giving the analyst guidance on how to
find the interactions
|
How
|
- Within the constraints
provided to it, the neural net algorithm takes a blind guess
at how to combine the inputs to fit the outputs
- The algorithm compares the predicted value to the actual,
and adjusts the parameters that generated its guess
- If the fit is better, the algorithm continues in a similar
direction. If the fit is worse, the algorithm switches
direction and changes one or more parameters in a different
way
- The comparison/continuation-vs-switch cycle continues for
a pre-determined number of iterations. Each time, the
network "learns" a bit more about which direction it should
be changing.
|
|